Confidence


About Confidence
Confidence is a powerful application for cross-platform differential expression analysis, with gene scoring and pathway analysis tools. Our platform integrates multiple statistical methods to provide robust and comprehensive results for your RNA-seq data.
Analyze your data using DESeq2, Limma, NOISeq, and edgeR simultaneously
Confidence score system ranks genes based on agreement across methods
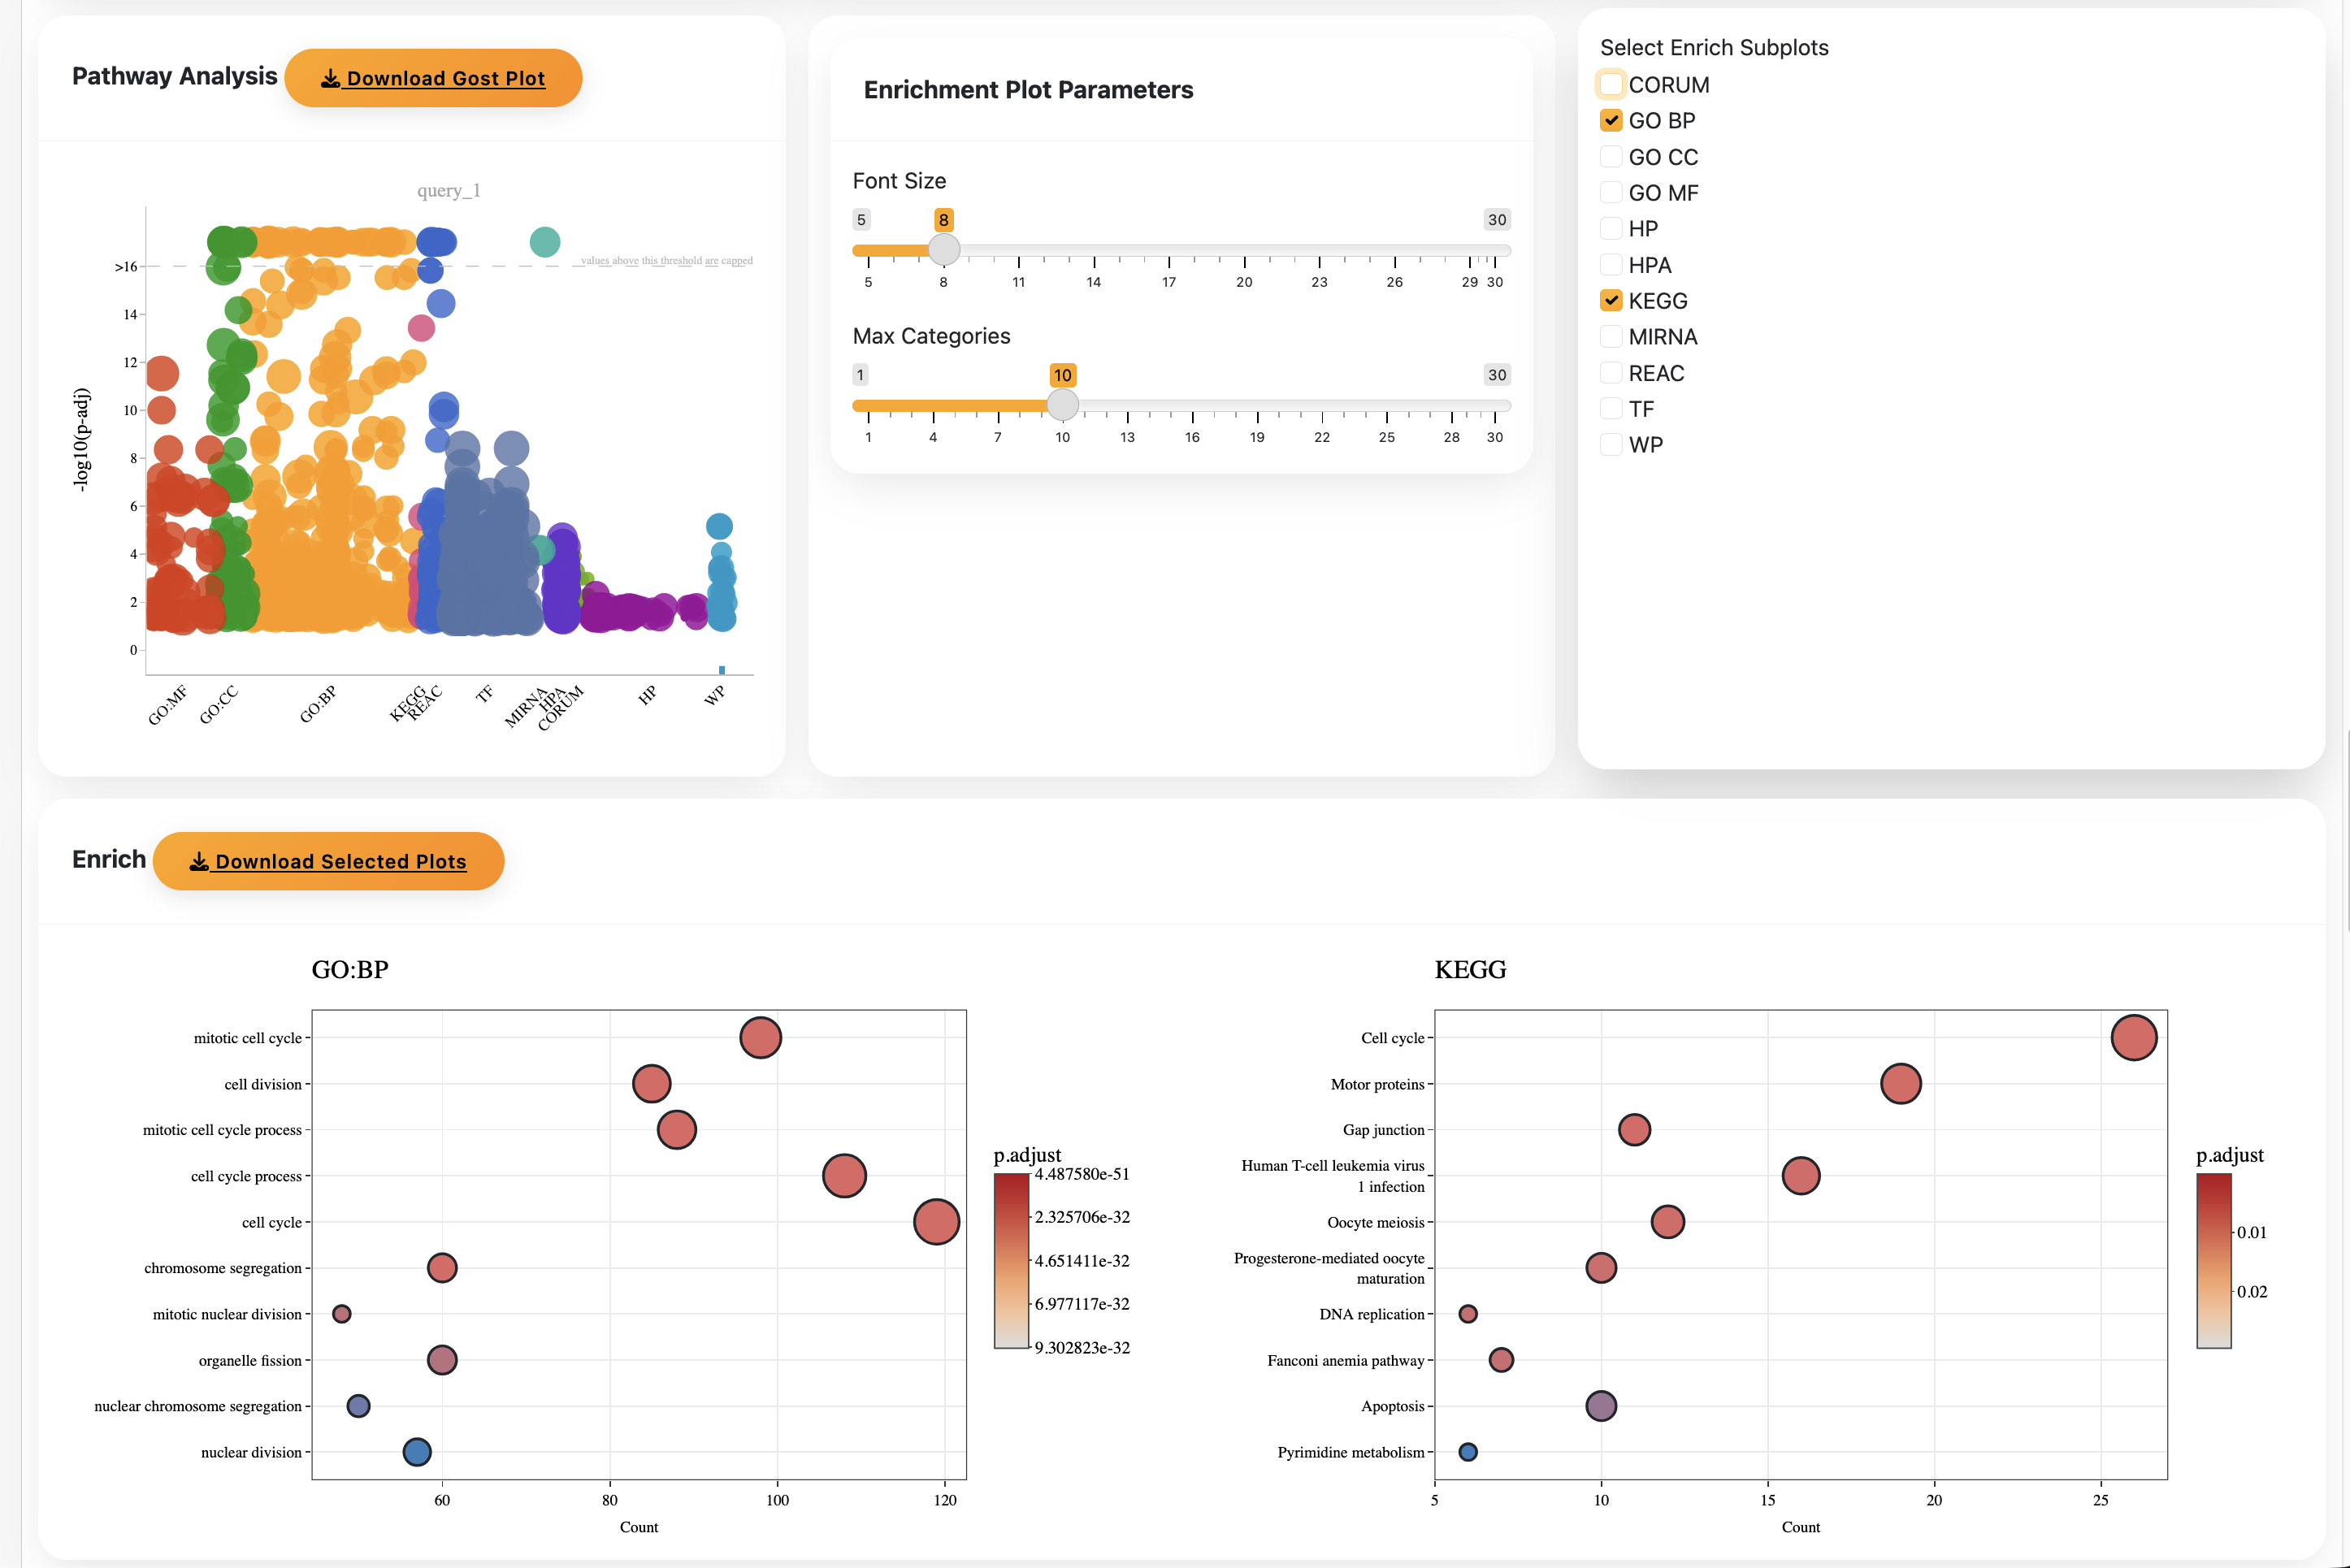
Integrated pathway analysis with GO, KEGG, and Reactome
Here is an example of the output from Confidence in a real world scenario.
1) The PCA plots are shown to allow you to choose what variables are important in your model
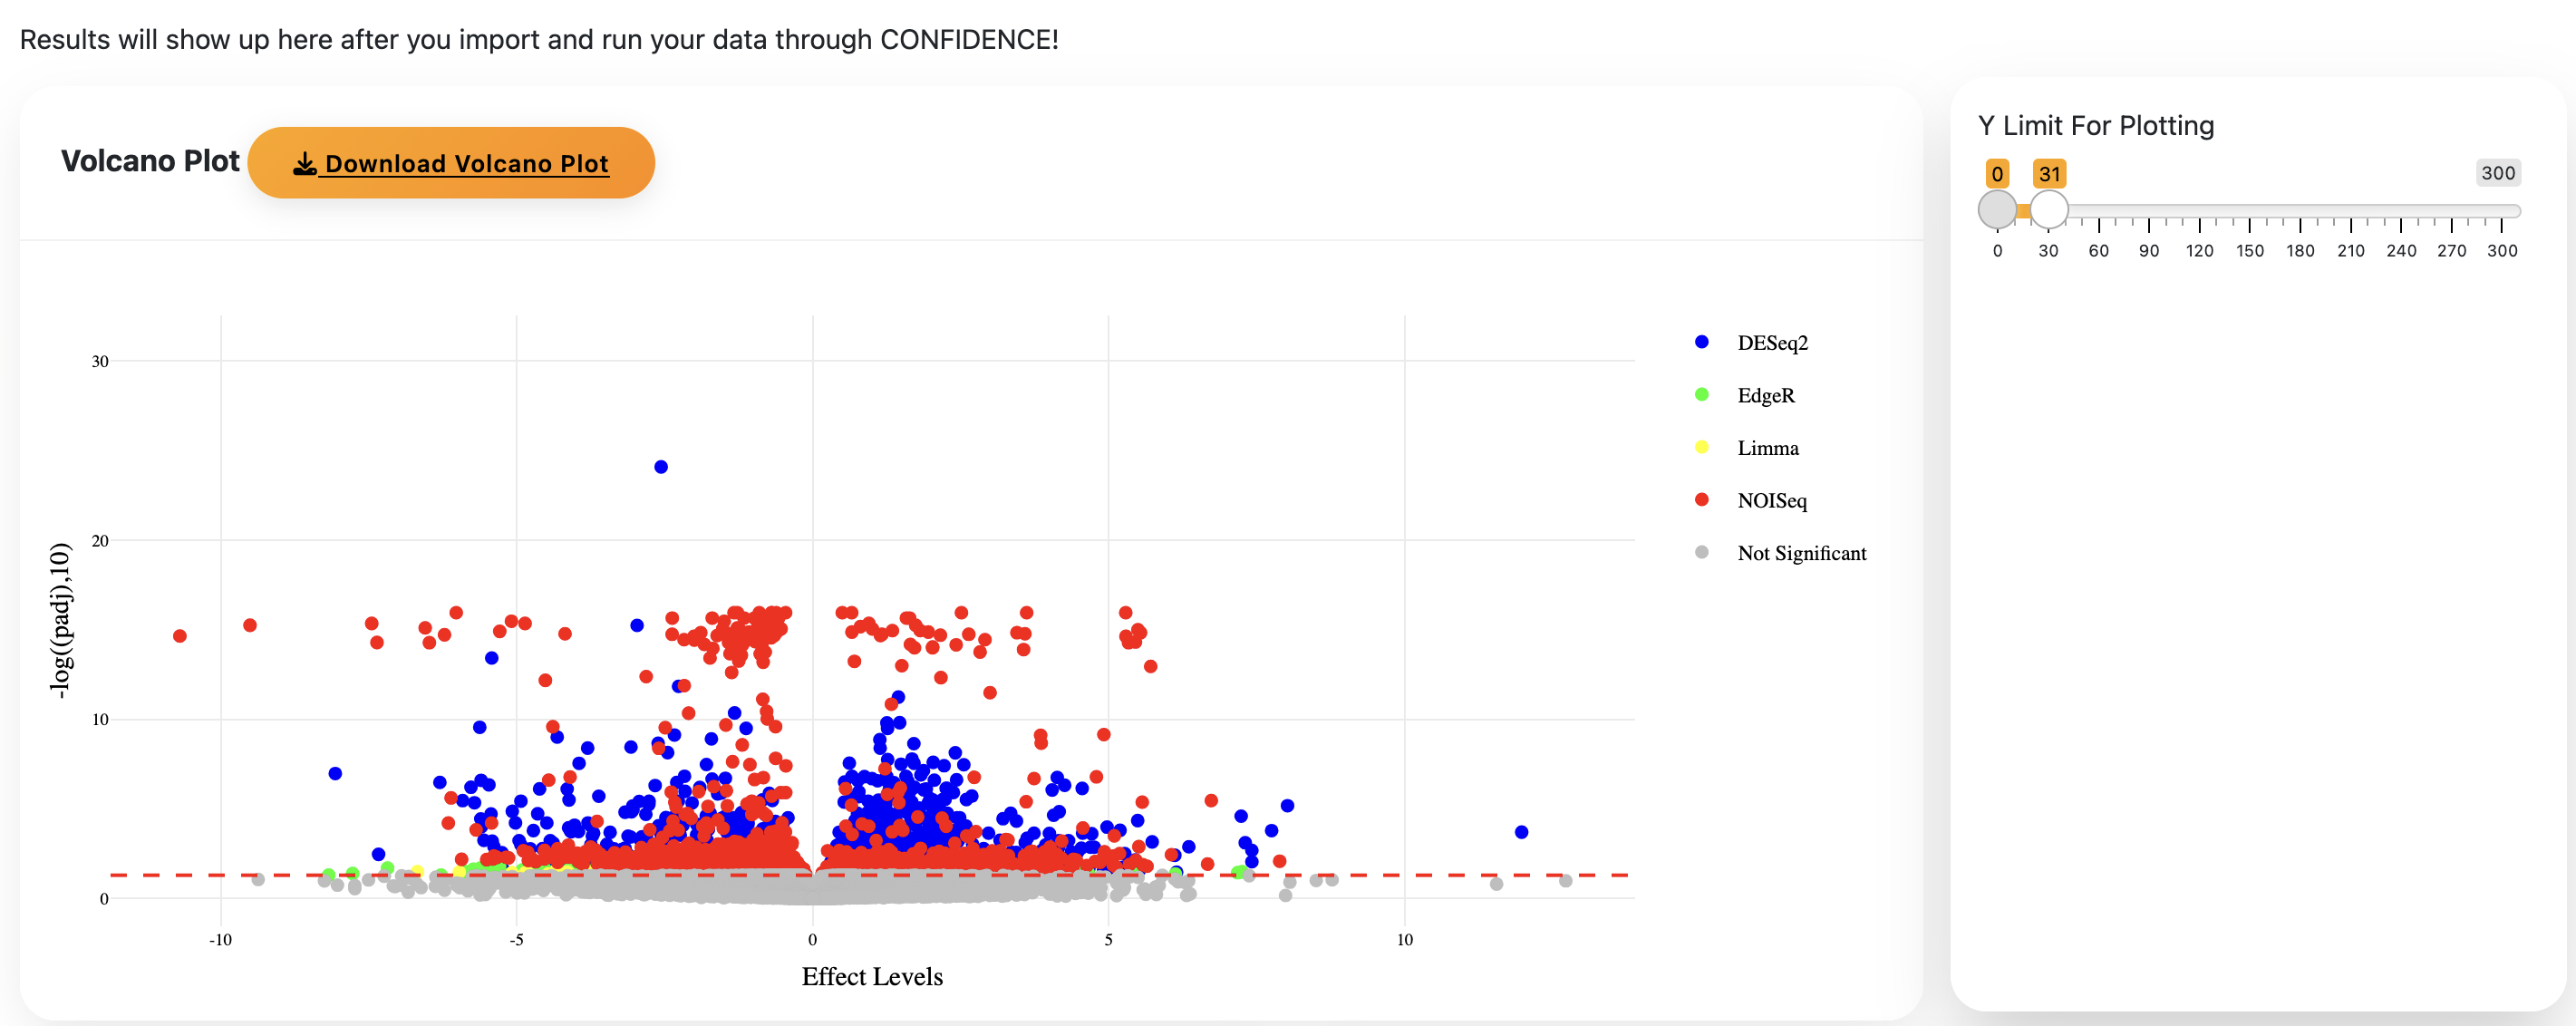
2) After running Confidence, a Volcano plot shows the differentially expressed genes between the two groups
Confidence Analysis
Welcome to Confidence, an application for cross-platform differential expression analysis, with gene scoring and pathway analysis tools.
The steps to using Confidence are simple!
Results will show up here after you import and run your data through CONFIDENCE!
Last updated on: February 26th, 2026
Steps to using Confidence are very easy! If at any point you are stuck, hover over the button and it will give you more information. The workflow is also described here.
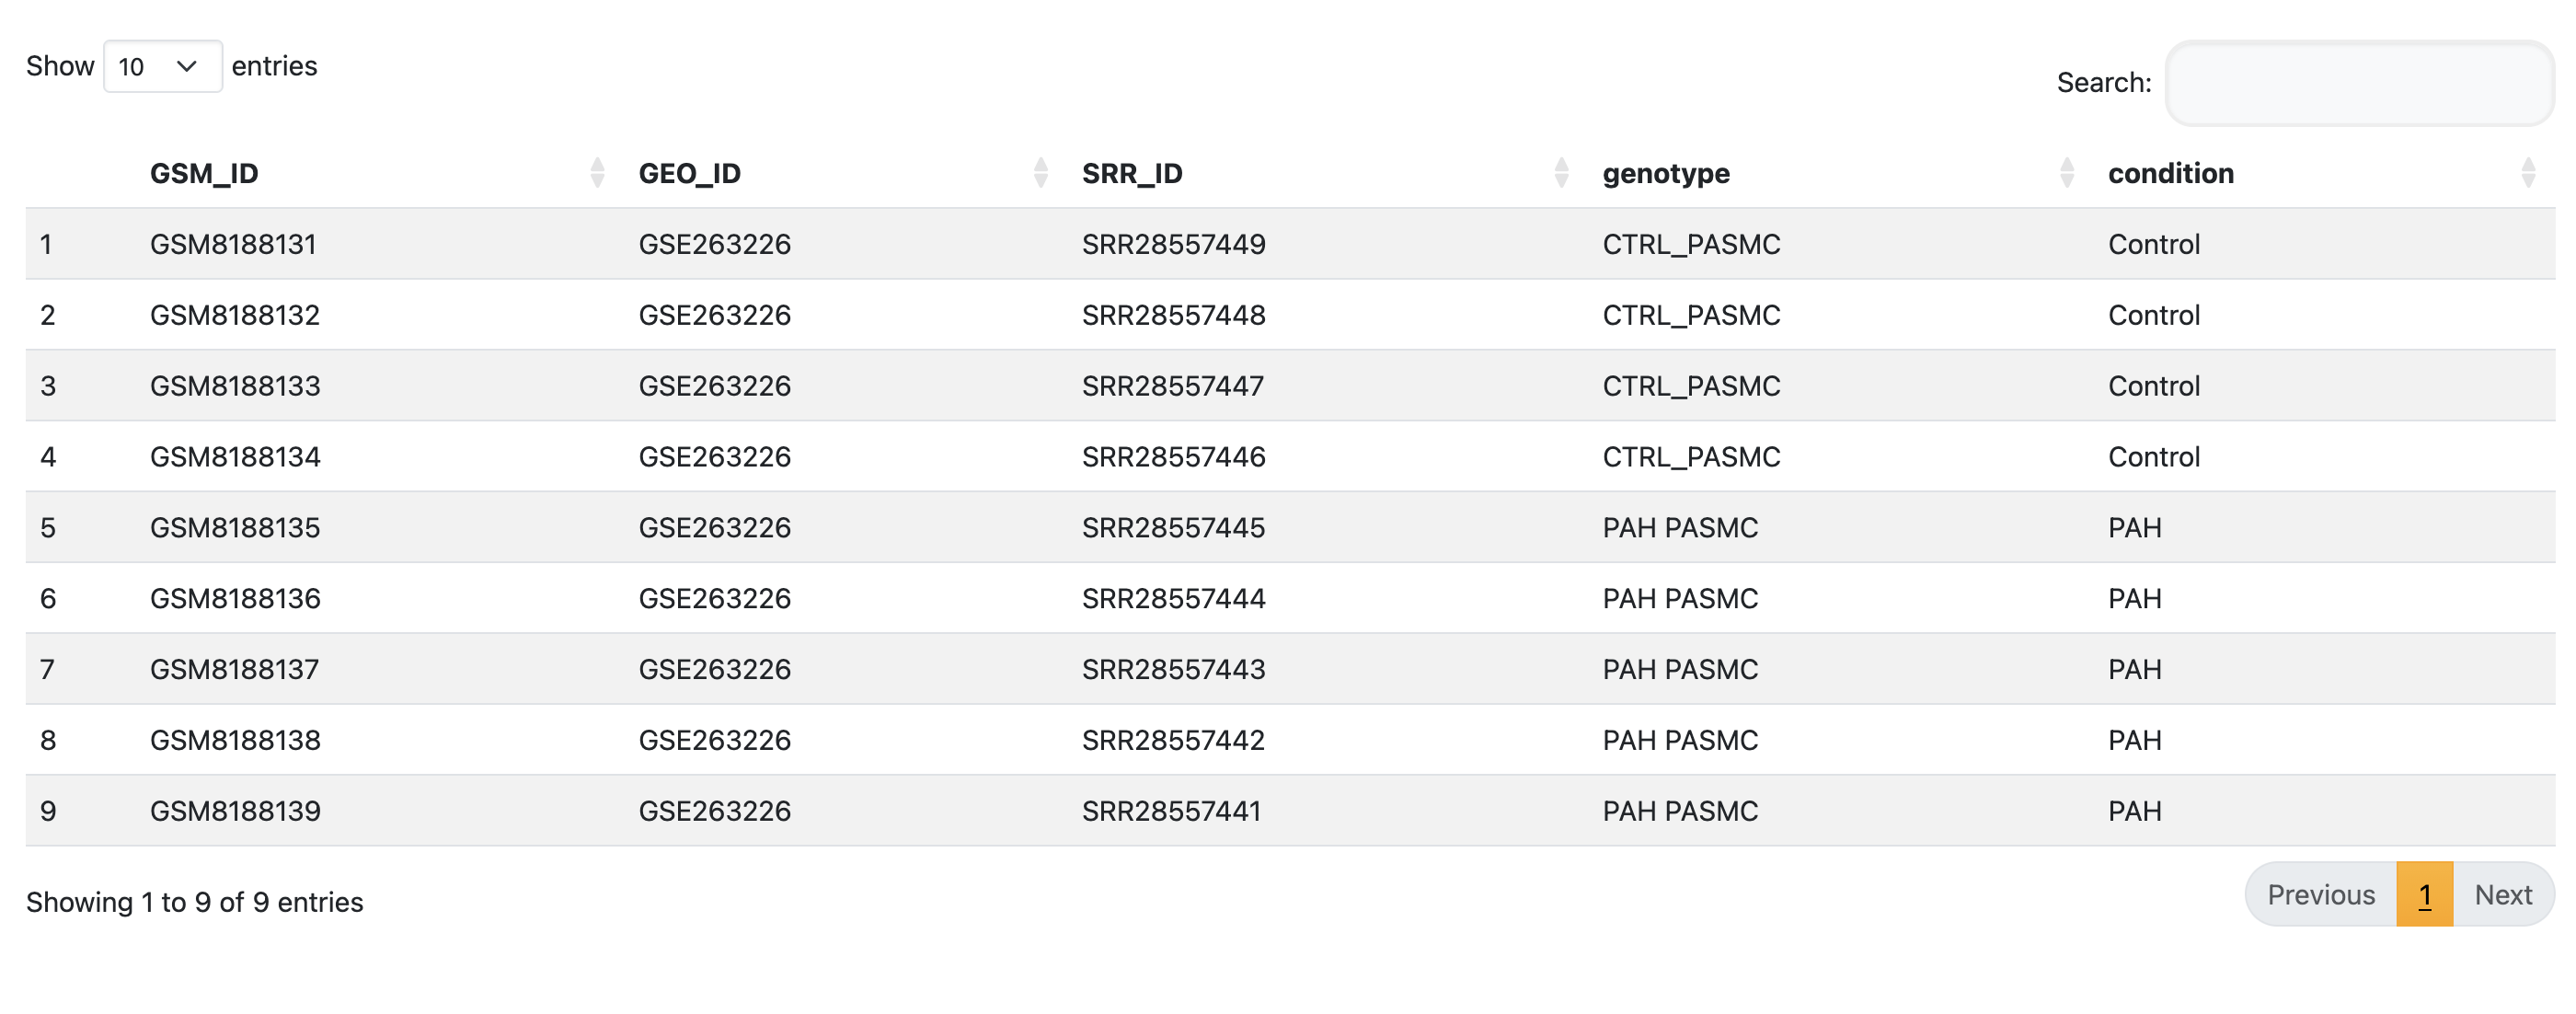
This is the most important step! Make sure that your matrix and counts files are formatted according to the format shown in the example. A formatted reference dataset from the publicly available dataset GSE263226 provided by Lemay et.al, 2025 is available for download as a reference. Please ensure that your files are formatted in the same manner.
Download Example FilesTake your formatted metadata file and upload it in Step 1. Wait for the application to read the file. Your metadata will then be shown as a table.
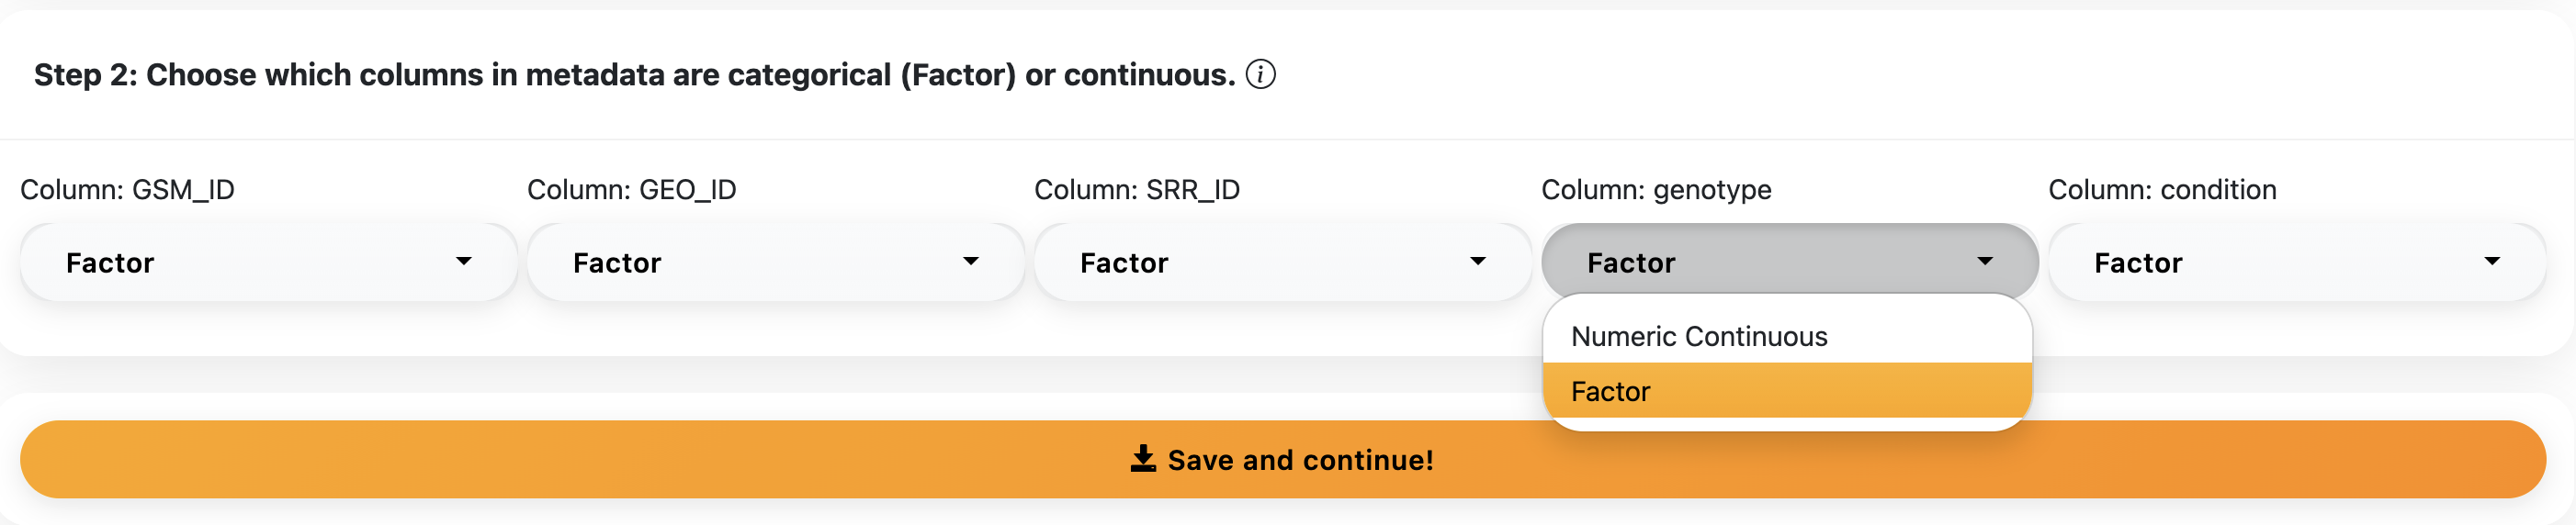
This step is important for downstream analysis. Make sure you choose the correct option for each metadata column as it will affect the statistical tests used downstream.
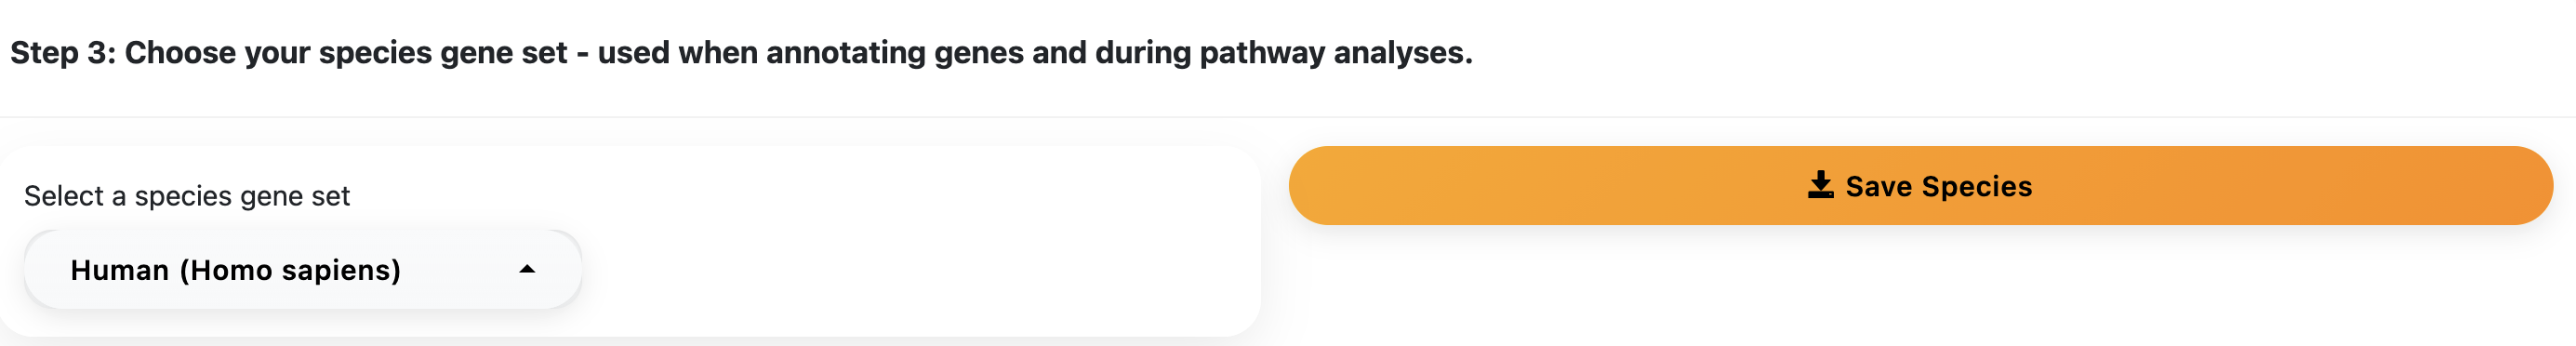
Based on your data, select the correct species reference genome dataset. Confidence currently supports 4 species: Rat, Mouse, Rabbit, and Human, all containing updated reference datasets.
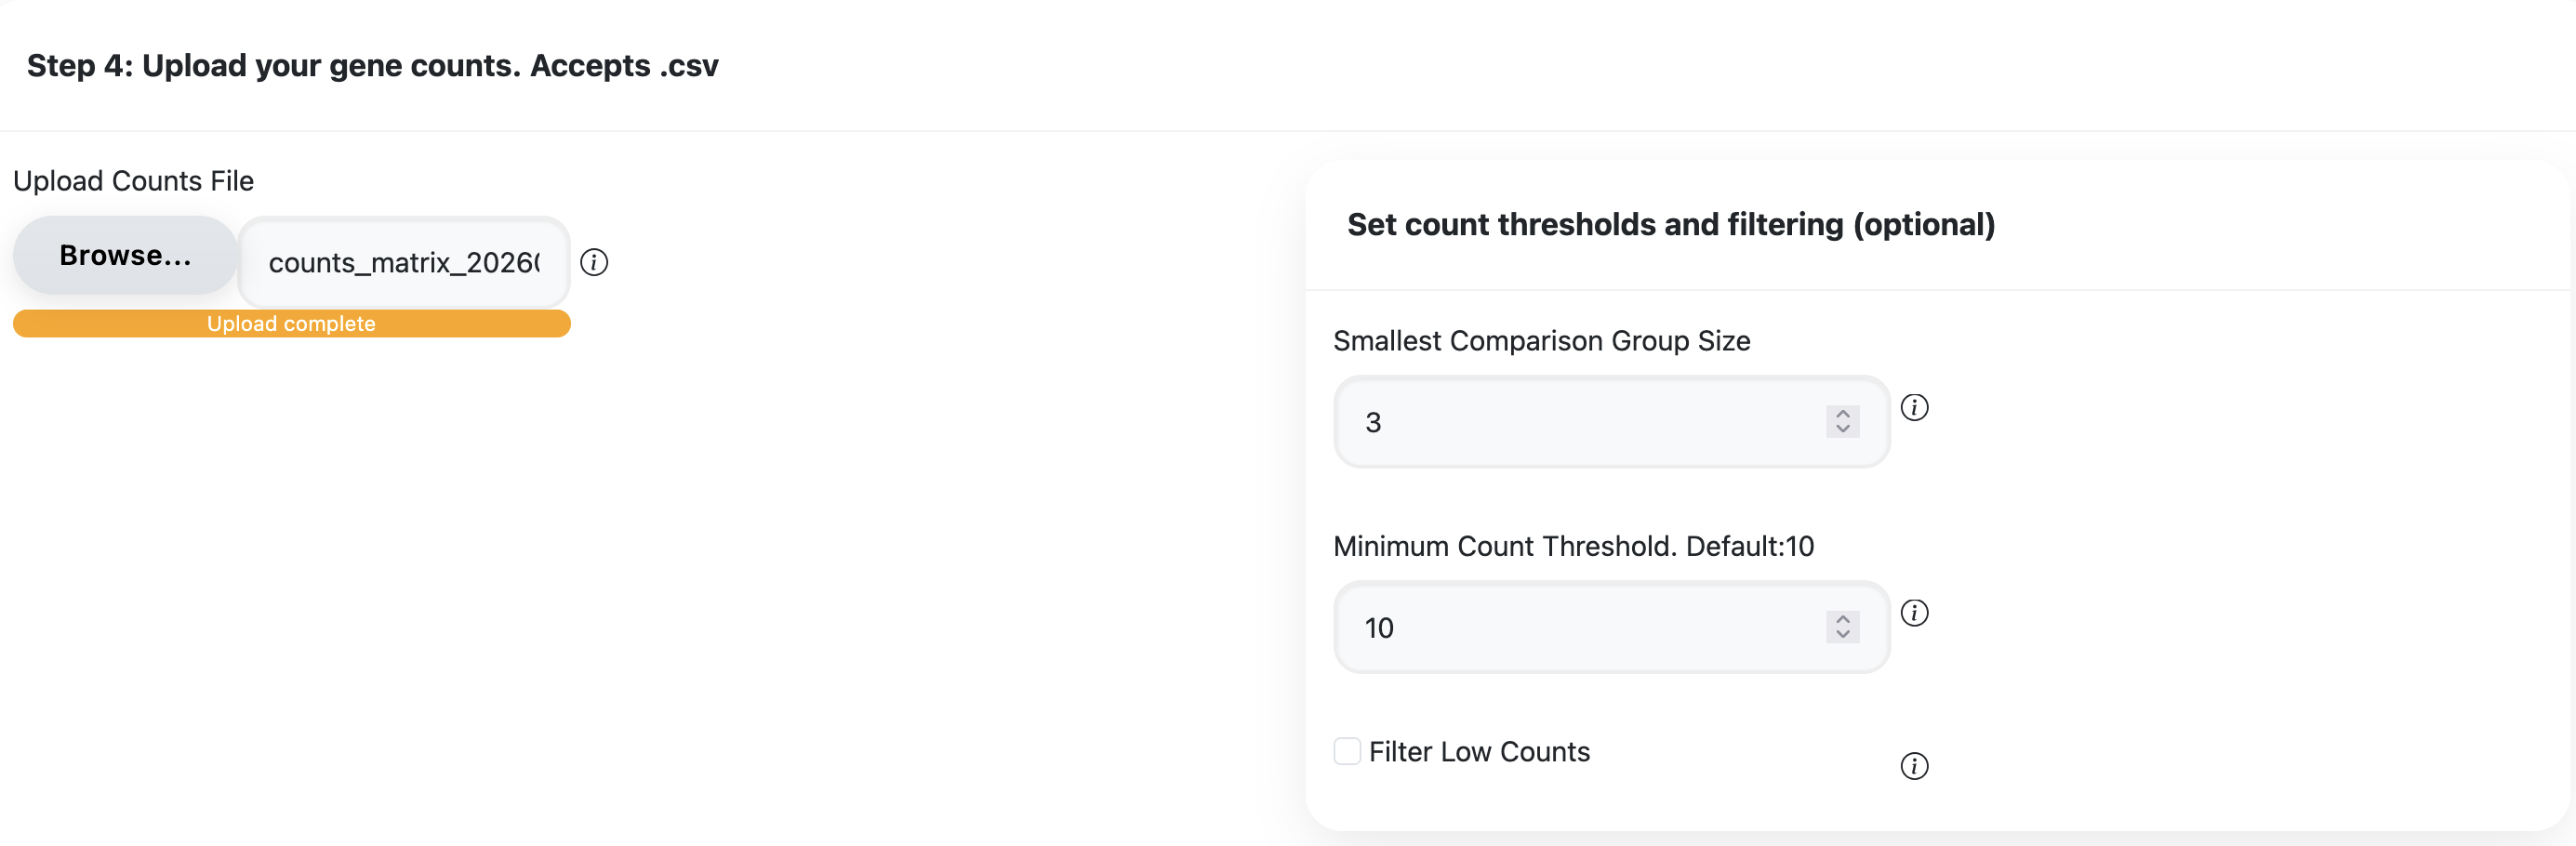
Upload your formatted counts file. Remember to make sure both your counts and metadata files are properly formatted before uploading.
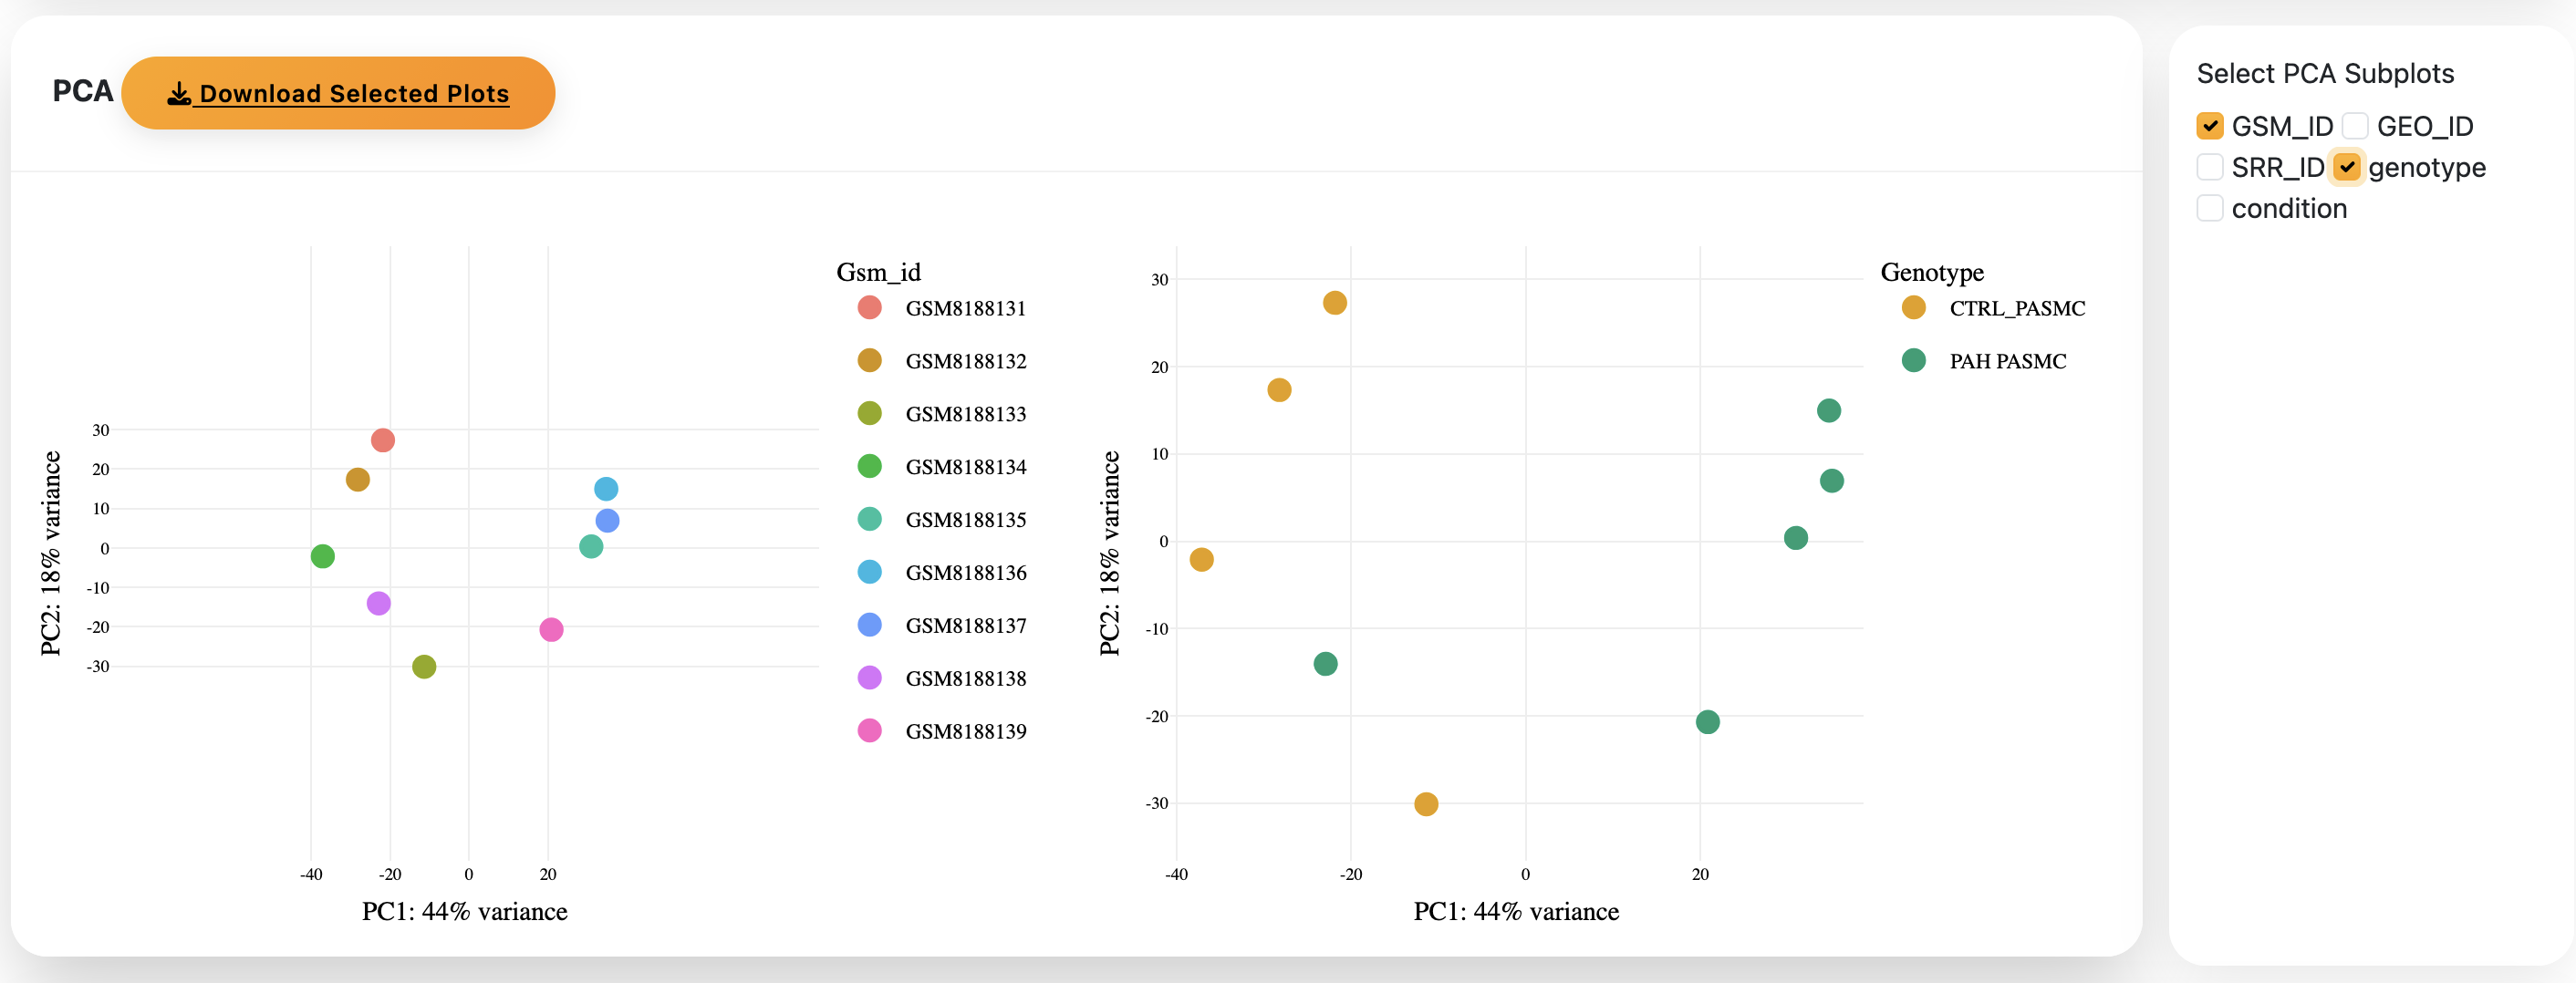
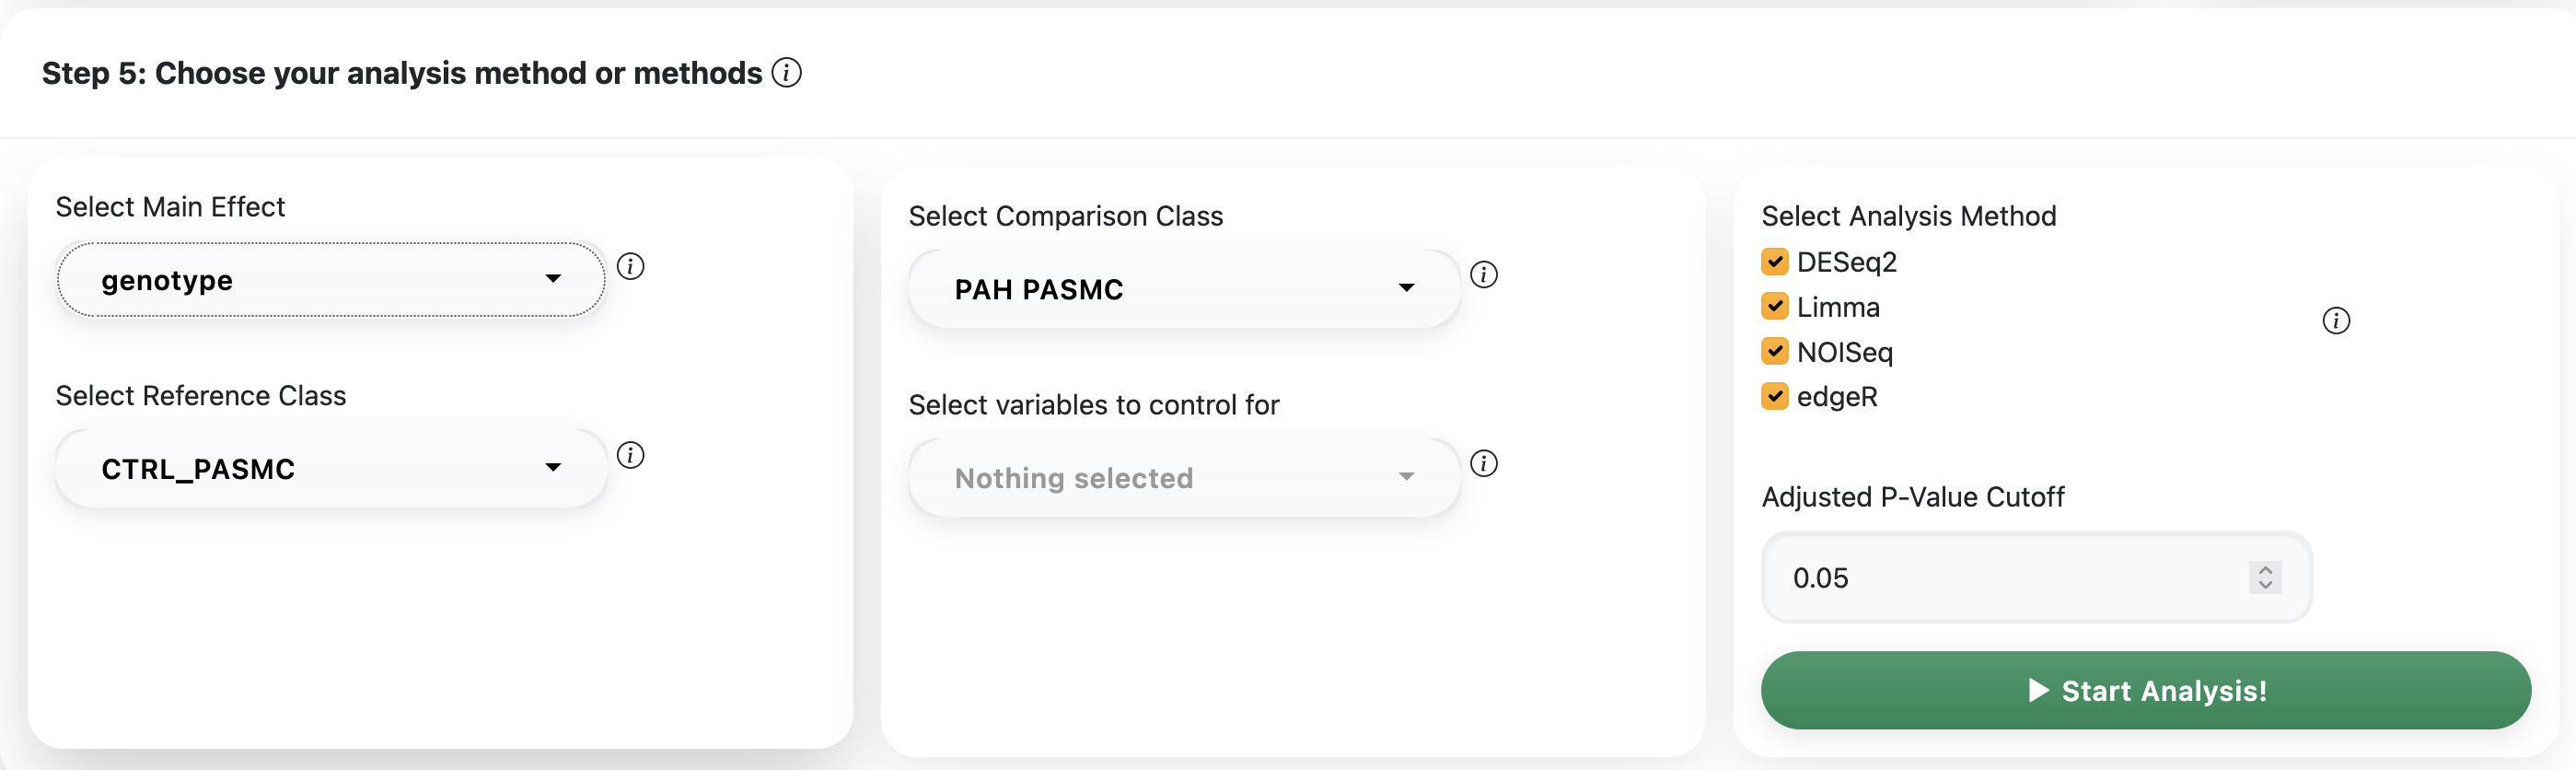
- Main effect: Select the variable you are studying. Options are drawn from your uploaded metadata.
- Reference class: Select the reference/control class
- Comparison class: Select the class you are comparing against (e.g disease/treatment)
- Control variables (optional): Add batch numbers or other covariates here.
Check the analysis methods you are interested in and hit the Start Analysis button.
- The volcano plot is interactive. NOISeq may produce many outliers causing results to cluster near the x-axis.
- Adjust the Y-axis limit to improve the plot. The app will reload briefly, do not refresh.
- Double-click a legend entry to isolate results from a specific method.
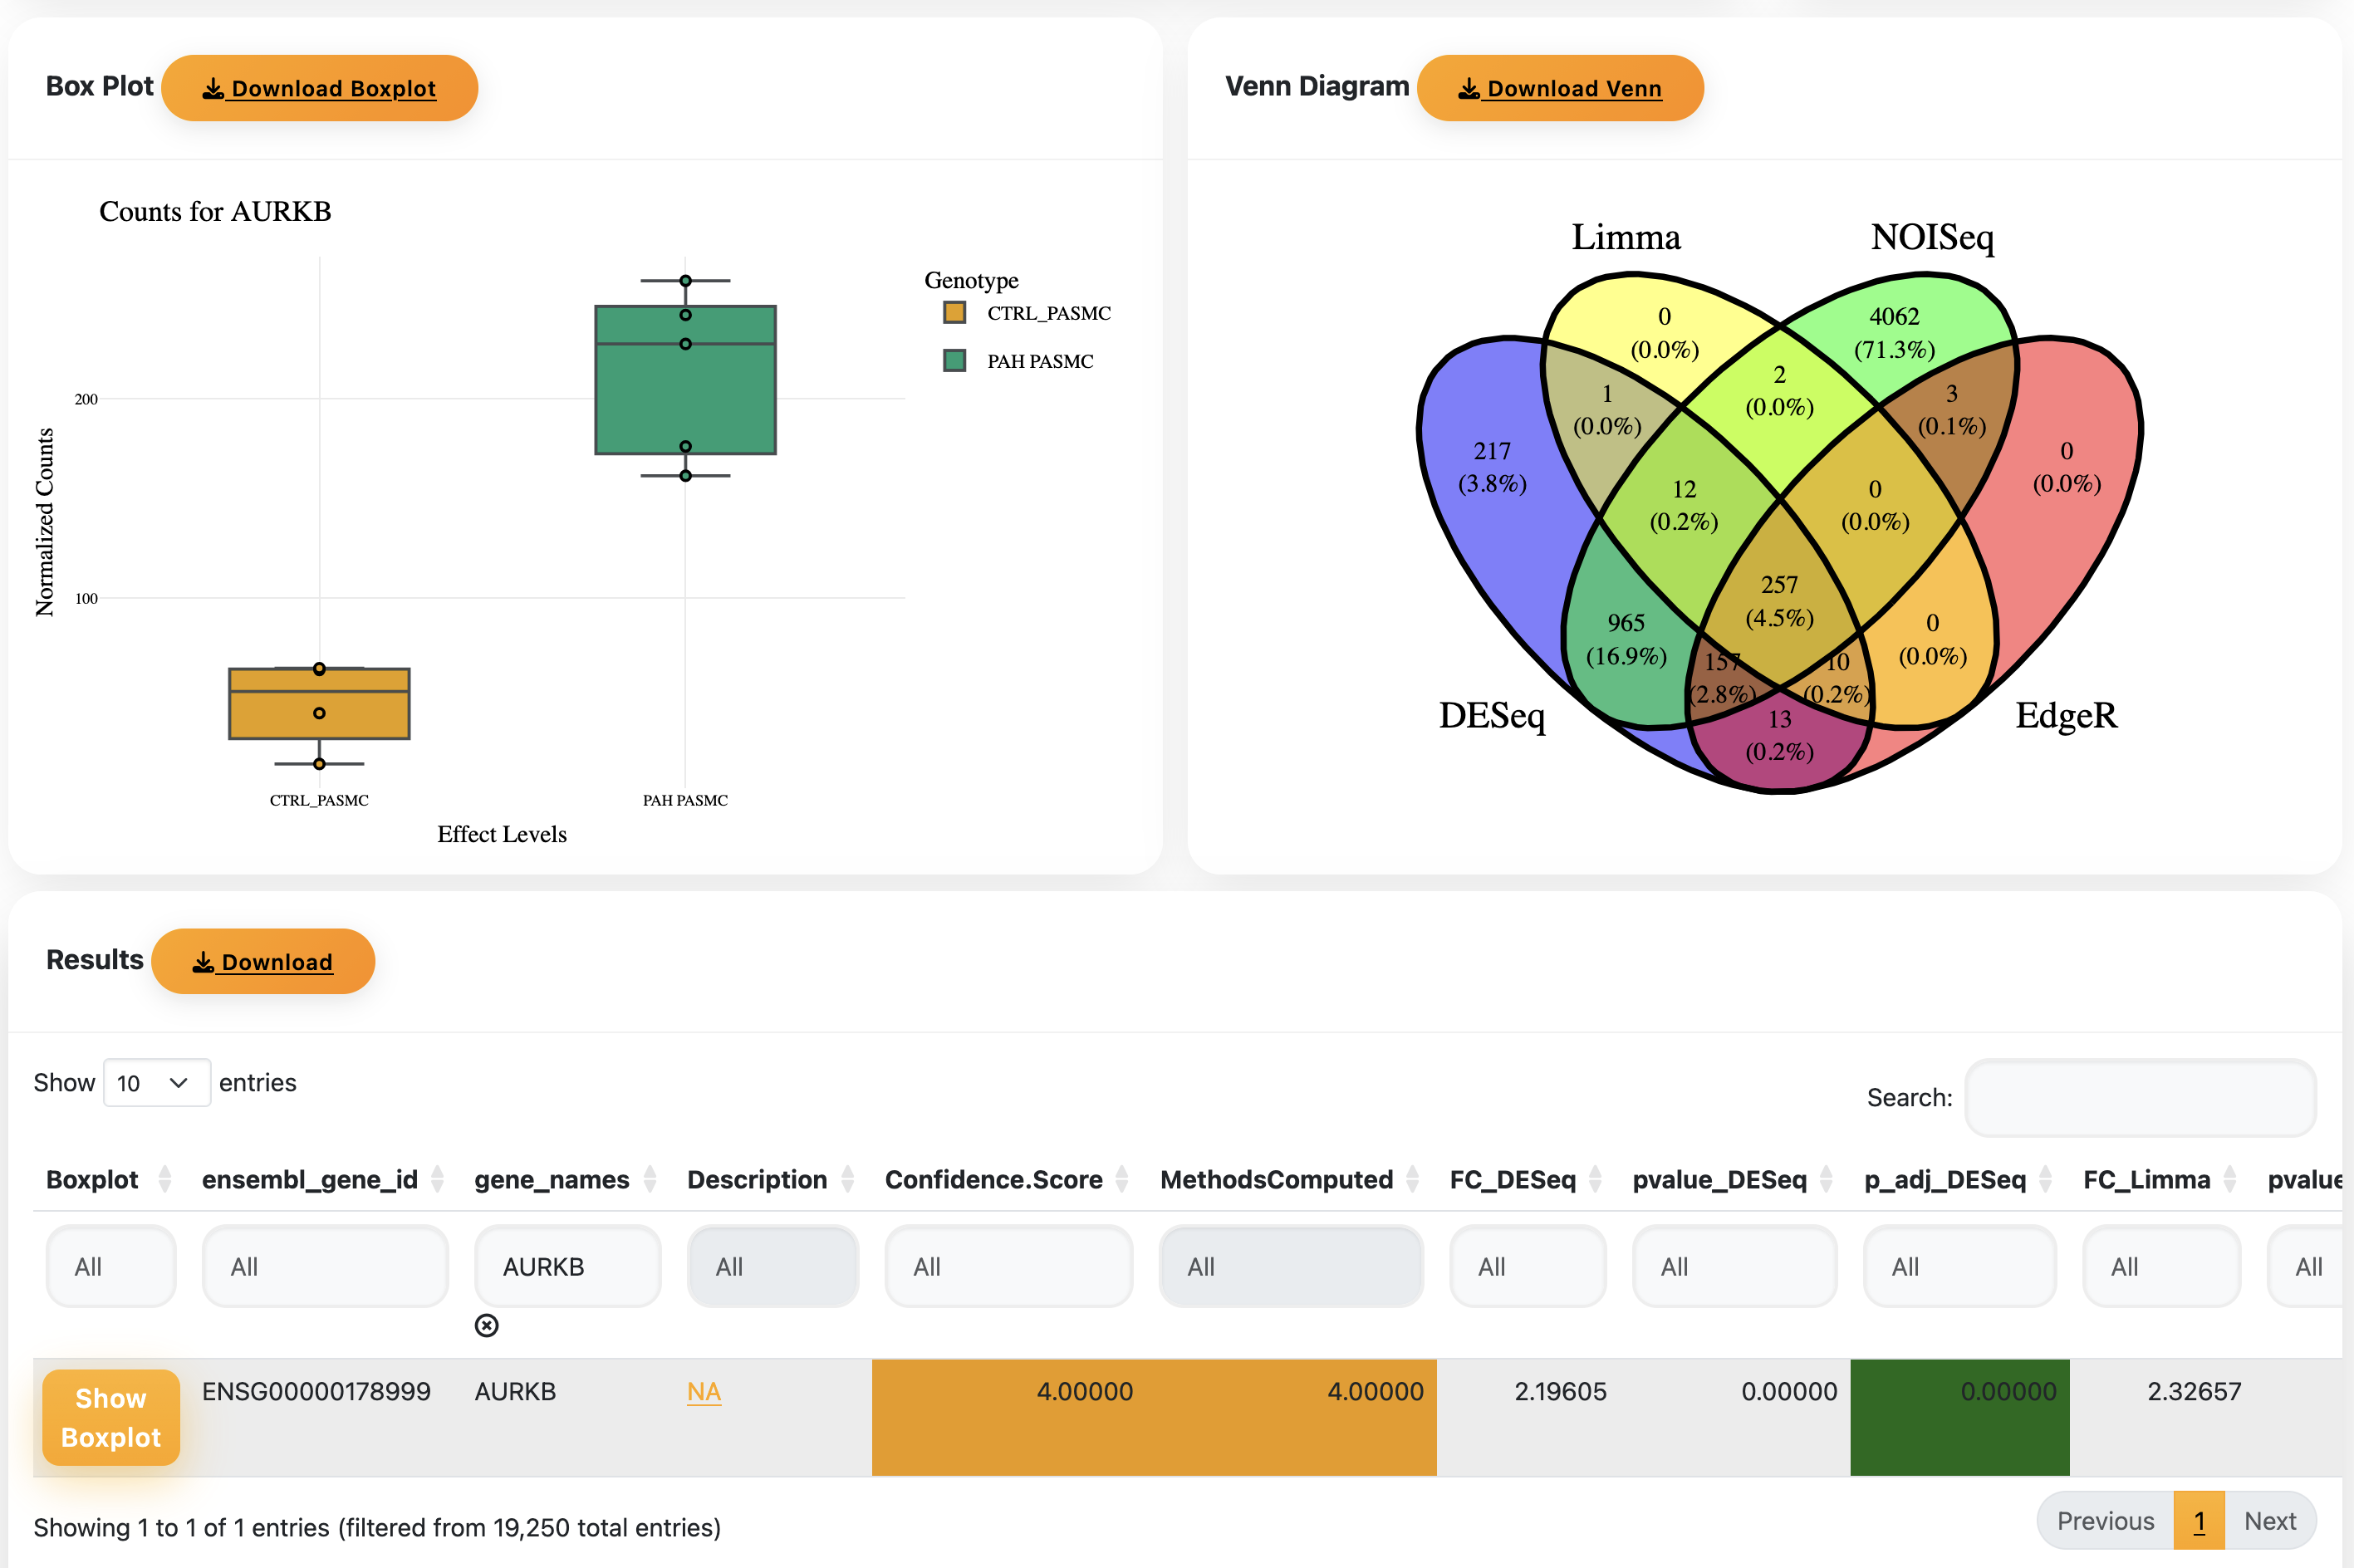
- The Venn diagram shows DEGs found across your selected methods.
- Scroll down to the results table. Enter a gene name to view its normalised counts box plot.
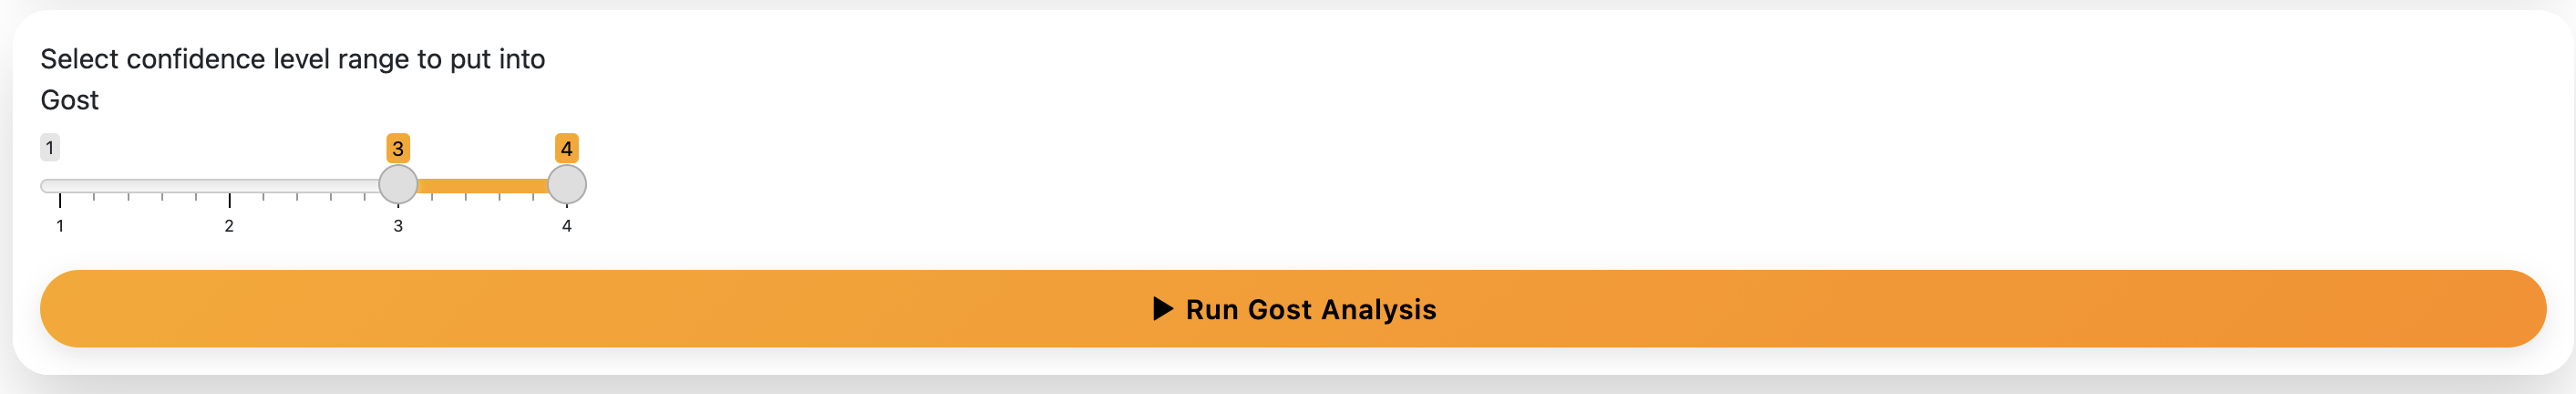
Select genes using your desired Confidence score threshold and run the Gost analysis. Depending on the score and number of genes, this may take a while. If it appears stuck, adjust the score and try again.
Select your enrichment method (BP, KEGG, etc.) and download individual plots.
That's it! That's how you use Confidence.
The most common reason Confidence fails to analyze data is related to formatting issues in the metadata and raw count files. Please review the common issues below. If Confidence does not perform as expected, please contact us at c.hindmarch@queensu.ca for assistance. In your help request, please include:
- Your count matrix file
- Your metadata file
- A description of the issue and/or a screenshot of the error message displayed
Confidence requires the metadata and count matrix to be formatted in a specific structure. Please ensure that:
- The first column of the count matrix contains gene IDs (or EnsembleID).
- Column headers in the count matrix file corresponds exactly to sample IDs listed in the metadata file.
- The metadata file includes a column specifying the experimental condition.
Please refer to the processed dataset from GEO (GSE263226) as an example to model your file formatting.
This is normal behaviour, especially after uploading files or starting analysis. The app is working in the background. Do not hit refresh as this will break your session.
NOISeq in particular can produce many outliers, causing results to cluster near the x-axis. Use the Y-axis limit adjustment to rescale the plot to a more readable range.
This most likely means your data was aligned using an older reference genome that does not match the current reference dataset in Confidence. Please check the genome version used during alignment and ensure it matches the selected species reference.
This may be due to temporary server issues. Please email us so we can investigate and restore functionality as quickly as possible.
This is a known issue related to gene annotation retrieval from BioMart. If specific gene labels are missing, you can download the full results table to verify statistical results. Alternatively, you can use the gene-specific box plot function to visualize normalized counts for genes of interest.
Copyright
Copyright © 2026 Charles Colin Thomas Hindmarch. All rights reserved. The Confidence application, including but not limited to its source code, object code, algorithms, architecture, design, documentation, user interface, and all related materials (collectively, the "Software"), is the sole and exclusive intellectual property of Dr Charles Colin Thomas Hindmarch. All rights, title, and interest in and to the Software are owned exclusively by Dr Hindmarch. No rights are granted except as expressly provided in a written license agreement. Unauthorized reproduction, modification, distribution, reverse engineering, or use of the Software is strictly prohibited.